We use administrative data to study the dynamics of domestic and international trade by private sector firms in Kenya during the Covid-19 crisis up until March 2021. At the onset of the pandemic firms in all sectors and regions of Kenya were hit by the initial Covid-19 shock. The aggregate inter-firm trade volume in April 2020 was down by 22% relative to April 2019. As sudden and sharp the impact of the shock was, domestic sales and purchases bounced back by August 2020. International trade flows recovered even more quickly. The by far hardest hit sector is hospitality as it has been directly affected by Covid-19 containment measures. In the first quarter of 2021 both sales and purchases of the sector were still down compared to pre-pandemic levels. As the pandemic is far from over, it will likely take a substantially longer time horizon to rebuild the sector.
Introduction
The pandemic and the resulting economic crisis have disrupted supply chains across the world. The story of Kenya’s private sector is no exception. As a result of Covid-19-related economic shocks Kenya faced its first recession in almost two decades.1 We document the evolution of firm-to-firm trade during different stages of the ongoing pandemic up until March 2021. To this end, we draw on administrative firm- and transaction-level tax records of formal private sector firms.
Figure 1: Weekly firm-to-firm transactions
![]()
Note: The figure shows the evolution of the percentage change in the number of purchase transactions relative to the weekly average number transactions in 2019. The data includes the universe of input VAT transactions reported by any tax filing entity.
We start by studying the evolution of weekly firm-to-firm purchase transactions from value- added tax records in Figure 1. The chart highlights key events of the epidemic in Kenya and the business cycle for 2019, 2020 and the first quarter of 2021. The number of firm-to-firm transactions started to fall substantially in the second half of March 2020, immediately after the first Covid case was reported in Kenya and a series of measures to contain the spread of Covid-19 were introduced. These included the closure of schools and universities, orders for restaurants to operate on a take-away basis and factories to introduce a shift rotation system to limit the number of social interactions.2 Since most transactions are usually reported for the last week of a given month, the drop in the number of transactions relative to the same week in March 2019 is particularly stark. From there, the number of transactions continues to decline for another two weeks as passenger travel in and out of the Kenya’s largest metropolitan areas was restricted, before the recovery process starts in mid-April. By early July the major domestic travel restrictions were lifted. By September, the evolution of inter-firm transactions has caught up with the regular fluctuations experienced in 2019. Most restrictions on the hospitality sector were removed by end of September. Schools, however, only reopened in January 2021. As cases began to rise again later that month, additional restrictions on the size of public gatherings were re-introduced. In March 2021, Kenya experienced its third and until then largest wave of Covid cases. The peak was reached in the final week of March 2021. In the same week restrictions on the hospitality sector and passenger travel for five counties in the Greater Nairobi metropolitan area were re-introduced.3 This is reflected in the final week observed in the transaction-level data. While the trajectory in 2021 has thus far largely followed the pre-pandemic fluctuations, the transactions in the last week of March again saw a decline of 15% relative to the 2019 average due to the evolution of the epidemic in Kenya. Overall, the transaction-level records suggest both a sharp initial downturn between March and April 2020, as well as a relatively swift recovery.
Figure 2: The evolution of firm-to-firm trade between January 2020 and March 2021
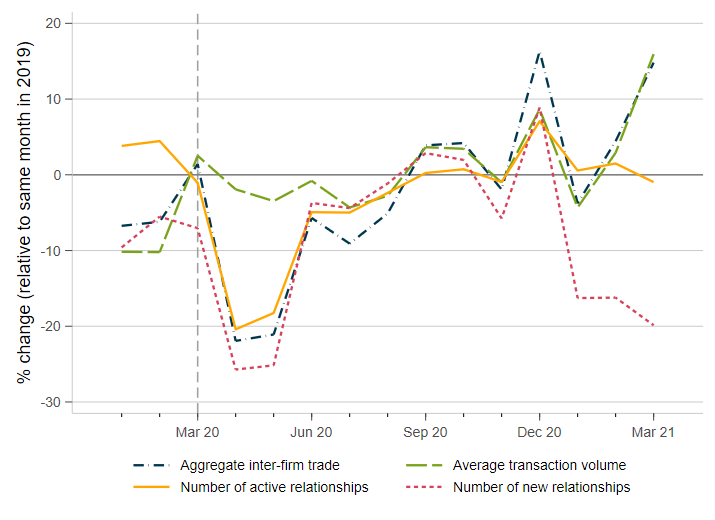
Note: The above graph shows the percentage change in firm-to-firm relationship outcomes relative to the same month in 2019. The indicators shown are (i) the aggregate inter-firm trade volume, (ii) the average transaction volume across all active firm-to-firm relationships, (iii) the number of active firm-to-firm relationships, (iv) the number of newly formed inter-firm relationships. Monetary outcomes are deflated using the monthly consumer price index published by the Kenya National Bureau of Statistics.
The downturn in firm-to-firm trade in the second quarter of 2020 was largely driven by a collapse in the number of active relationships (yellow line in Figure 2) The average transaction volume of relationships that remained active dropped only slightly below pre-pandemic levels (green line in Figure 2). This suggests that the adjustments to the extensive margin of inter-firm trade are the main driver of the collapse in domestic trade during the initial phase of the economic crisis. The pandemic made it more challenging for firms to form new relationships with buyers and suppliers and keep existing ones active. However, it is noteworthy that the number of newly formed relationships had already started out at a lower level at 10% below the level observed in January 2019 before the onset of the pandemic. Between April 2019 and April 2020 the number of active existing and new relationships then dropped by 20% and 26% respectively. Both measures recovered relatively swiftly by June 2020 and follow a similar trajectory up until the end of 2020. In early 2021, the number of new relationships, however, again saw a drastic decline relative to the figures recorded in the same months in 2019. Some of the observed de- cline mirrors the trajectory observed prior to the Covid-19 crisis in the early months of 2020. In addition, part of the additional downturn could be driven the rise in Covid-19 cases and the need for social distancing during this period, which might to have had adverse consequences for the ability to find new suppliers or buyers.
To get a more complete picture of private sector dynamics in Kenya since the onset of the pandemic, we plot the changes in aggregate domestic sales and purchases, imports, exports, employment, and the number of active firms relative to 2019 in Figure 3. The picture that emerges largely mirrors the one for inter-firm trade. Domestic sales, purchases and imports all dropped between 21% and 28% between April 2019 and April 2020. During this period the majority of firms continue to report positive sales. However, the number of firms that still record positive sales in April and May 2020 is only 5% below the number of active firms counted in 2019. By August the number of active firms again matches the count observed in August 2019. However, at the start of 2020 the number of active firms counted exceeded the 2019-levels by 5%. This indicates that despite the evident quick re-bounce, it is important to keep in mind that the re-bounce has not been strong enough to fully make up for the lost growth that the private sec- tor would have otherwise experienced in 2020. Turning to the private sector’s link with global supply chains, the decline in aggregate export volumes was less drastic and recovered by May 2020. Figure 3 further shows that imports recovered more quickly than domestic purchases and saw an extraordinary boost in the second half of 2020. The more favourable trajectory for international trade flows indicates a large degree of resilience of global supply chains and the firms linked to them. Despite the favourable outlook employment levels have not recovered to a similar extent. In early 2021, aggregate employment remained 9% below the level observed during the same period in 2019. This trend is largely driven by the manufacturing (see Figure 4) and hospitality sector. In other sectors, in particular wholesale and retail, and administrative services, employment has almost reached pre-pandemic levels by March 2021.
Figure 3: Firm dynamics between January 2020 and March 2021
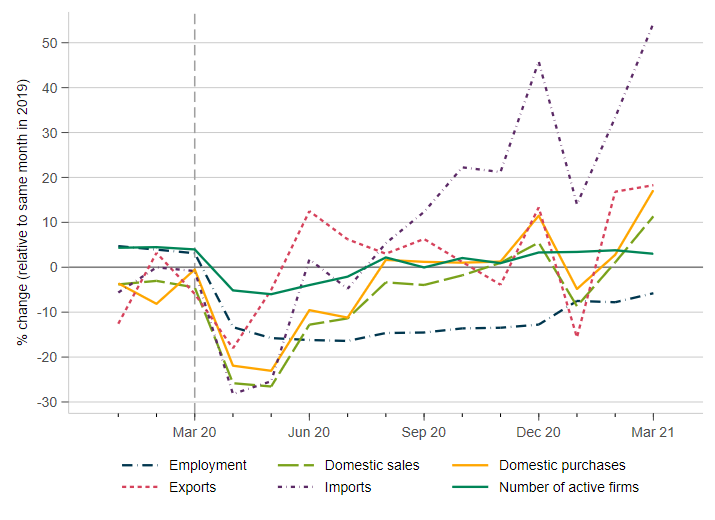
Note: The above graph shows the percentage change in major firm outcomes relative to the same month in 2019. The indicators plotted are (i) the overall number of employees, (ii) total domestic sales of all firms, (iii) domestic purchases, (iv) exports, (v) imports, and (vi) (vi) the number of active firms, i.e. firms with positive sales. Monetary outcomes are deflated using the monthly consumer price index published by the Kenya National Bureau of Statistics.
Figure 4: Firm dynamics in the manufacturing, and wholesale and retail sector
Manufacturing
Wholesale and Retail
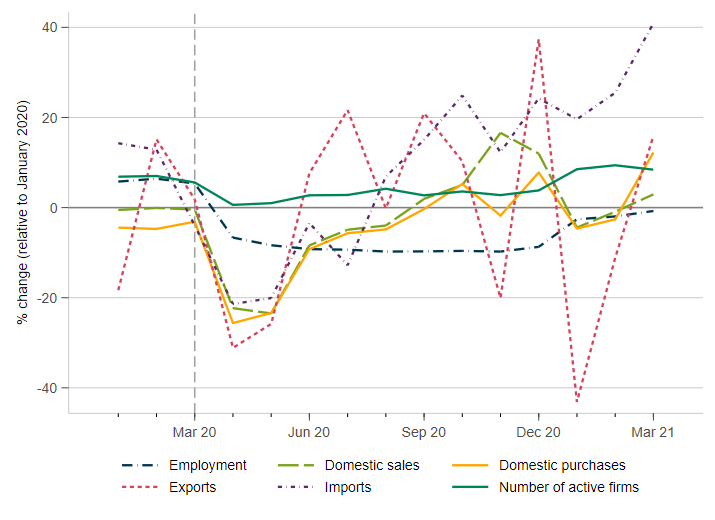
Note: The above graph shows the percentage change in major firm outcomes relative to the same month in 2019. The indicators plotted are (i) the overall number of employees, (ii) total domestic sales of all firms, (iii) domestic purchases, (iv) exports, (v) imports, and (vi) (vi) the number of active firms, i.e. firms with positive sales. Manufacturing, and wholesale and retail are the two largest sectors in terms of sales and jointly account for 45% of the domestic sales of formal private sector firms. Monetary outcomes are deflated using the monthly consumer price index published by the Kenya National Bureau of Statistics.
Mapping aggregate trade flows between sectors and geographies
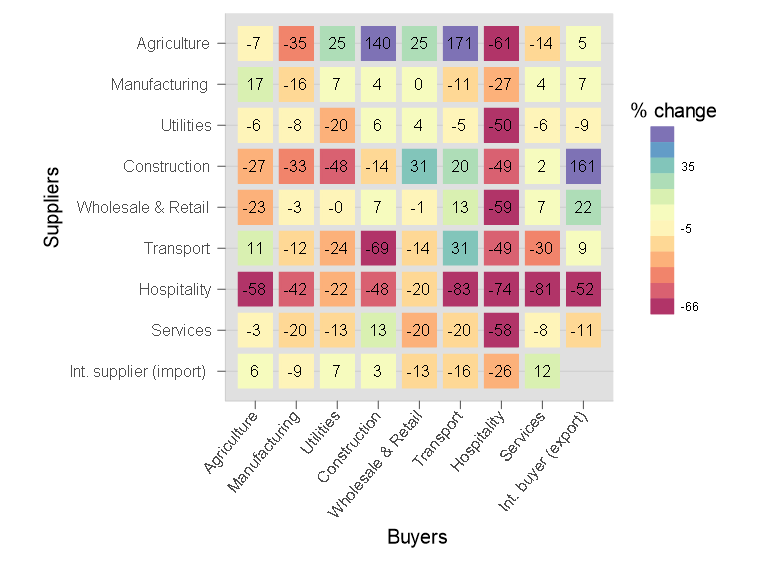
To get a better picture of the variation in the impact of the Covid-19 crisis on private sector dynamics in Kenya, we aggregate inter-firm trade flows to the sector and regional level. The bot- tom panel of Figure 5 shows the year-over-year change in aggregate annual trade flows between sectors. It shows that only few inter-sectoral trade flows saw as sharp of a decline between 2019 and 2020. However, comparing the change in trade flows for April 2020 relative to April 2019 in Figure 6 (top-left panel), we see that the initial downturn almost uniformly hit trade between all sectors. Moving through 2020, we see sectors recovering at different paces. For example, the largest of all inter-sectoral trade flows - between manufacturing firms and wholesale and retail firms - remained stagnant between June 2019 and June 2020 (see top-right panel of Figure 6). By October, a majority of the inter-sectoral trade flows shows a positive change relative to its 2019-levels. The change is particularly pronounced for imports (bottom row of the graph). It further highlights that the boost in imports is witnessed across sectors. The additional rise in imports in the first quarter of 2021, however, is particularly pronounced for the manufacturing sector (see Figures 6 and 4). At the same time the manufacturing sector’s inputs from other sectors of the economy have only increased moderately or even declined between February 2020 and 2021. Its inputs from the service sector remain at 15% below the levels observed in February 2020. This could be a hint that domestic supply chains still face challenges in their recovery leading to some manufacturing firms turning to global markets instead.
Figure 5: Changes in trade flows across geographies and sectors between 2019 and 2020
Trade flows between counties
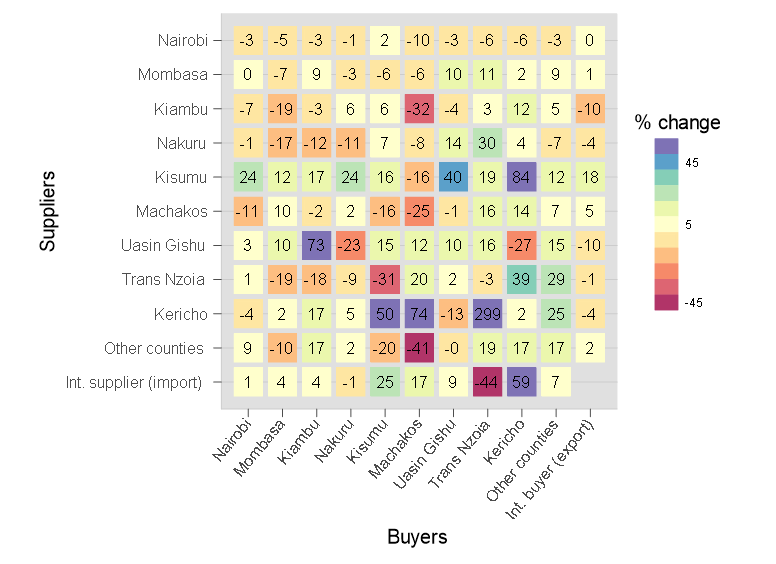
Trade flows between sectors
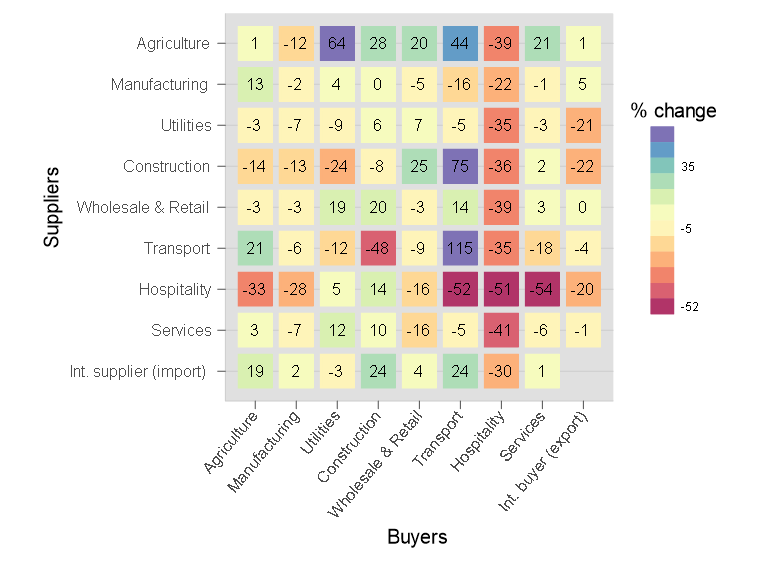
Note: The above graphs plot the percentage changes in aggregate trade flows across sectors and counties (first administrative layer) between 2019 and 2020. All trade flows are deflated using the monthly consumer price index published by the Kenya National Bureau of Statistics.
Unsurprisingly the hospitality sector has been the most adversely affected by the pandemic in 2020 (see Figure 5), and sector-level sales volumes remained well below 2019-levels even in the first quarter of 2021 (see Figure 6). The sector only plays a minor role in inter-firm trade and about 80% of its sales are generated through sales to final consumers. Nevertheless, the closure of hotels and restaurants to contain the spread of Covid-19 had a pronounced impact on the trade volume of the hospitality sector with all other sectors in the economy. Purchases of the hospitality sector from any other sector of the economy declined between 14% and 38%. The sector only boosted its sales to the energy and construction sectors relative to 2019. Its sales to other service industries dropped by as much as 50%.
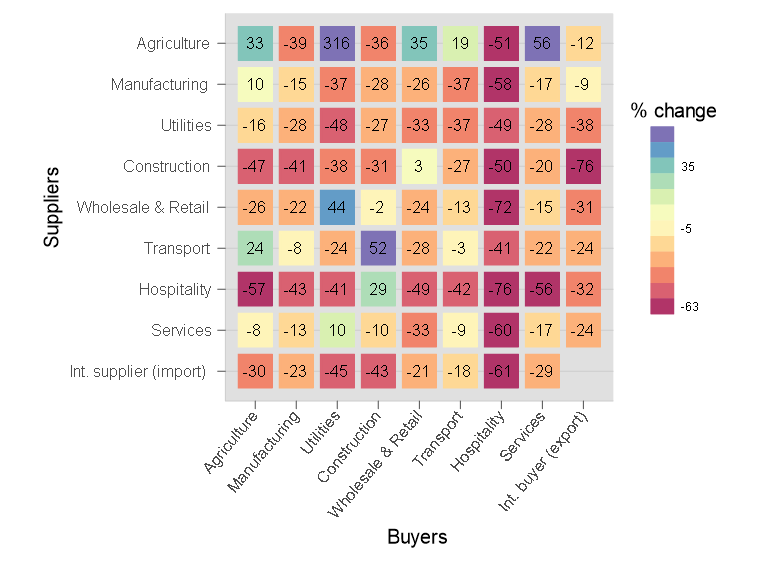
Figure 6: Change in monthly trade flows relative to same month in previous year
April 2020
July 2020
October 2020
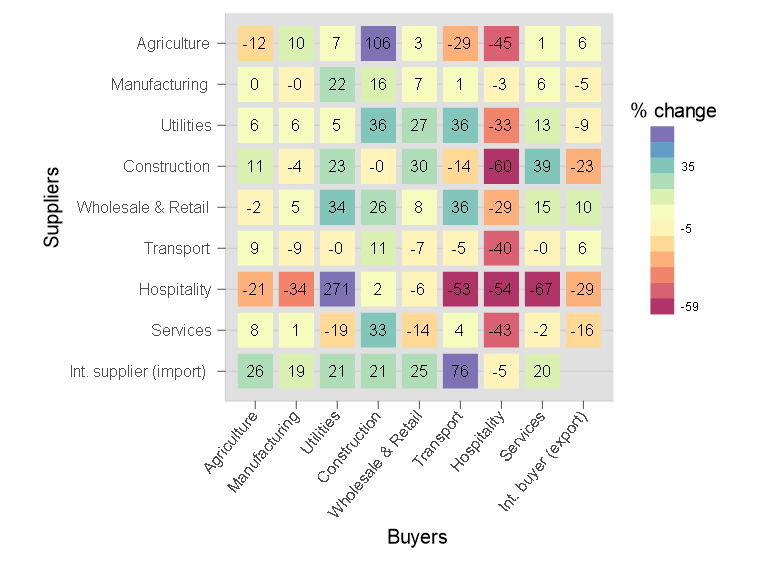
February 2021
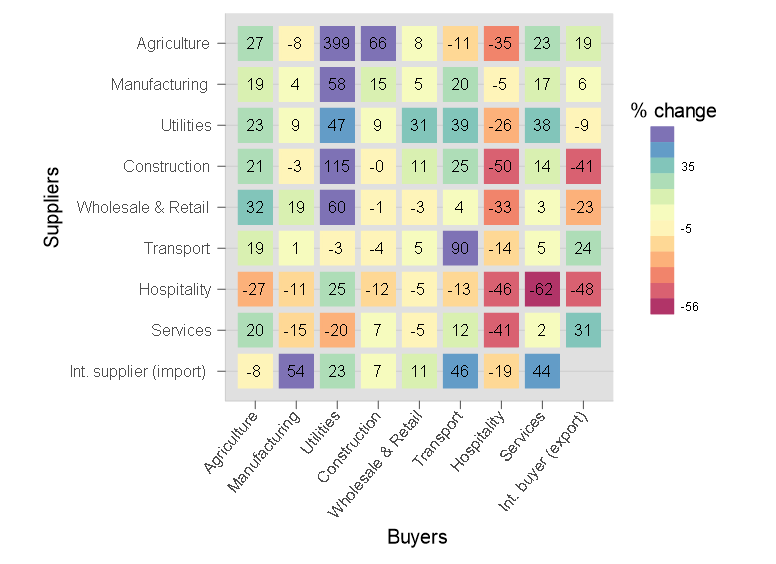
Note: The above graphs plot the percentage change in aggregate trade flows between sectors. The top-left graph shows the change between April 2019 and April 2020, the top-right graph shows the change between July 2019 and July 2020, the bottom-left graph the change between October 2019 and 2020, and finally the bottom right graph the change between February 2020 and February 2021. All trade flows are deflated using the monthly consumer price index published by the Kenya National Bureau of Statistics.
Information on firm headquarters further allows us to map the geographic dimension of the shift trade flows during the pandemic. 60% of the domestic firm-to-firm trade takes place within Nairobi. Imports from abroad are the second most important source for Nairobi’s formal private sector firms. In addition, Nairobi-based firms supply more to the rest of the country than they source from other counties. Put differently, trade flows out of Nairobi are larger than trade flows into Nairobi. In Figure 5 we map the annual change in trade flows for 2020 between Kenyan counties as well as imports and exports of firms headquartered in the respective counties. While the aggregate sales of Nairobi and Mombasa-based firms see an at most 10% decline between 2019 and 2020, the lack of growth compared to the pre-pandemic period is even more striking. To give an idea, in 2019, sales of Nairobi and Mombasa-headquartered firms, grew between 5 and 27% to almost all other regions of Kenya.4 The story for trade flows between counties other than Nairobi and Mombasa is more mixed. In particular, firms headquartered in Kisumu, Kenya’s third largest metropolitan area, saw a relative boost in their sales to firms across the country as well as abroad. In contrast, firms headquartered in Nakuru county, the centre of Kenya’s cut flower sector, saw their exports decline by 4% relative to 2019.
Outlook
Using administrative records to study the medium-run dynamics of Kenya’s private sector during the Covid-19 pandemic, it becomes clear that firms and inter-firm relationships recovered relatively swiftly. However, the observed private sector dynamics and the bounce back of firms outside the hospitality sector to pre-pandemic levels fall short of making up for the lost growth in 2020.
Firms responded to the initial downturn by laying off employees. While a lot of firms have brought their employees back by the end of 2020, the aggregate level of formal employment in private sector firms is still down by 8% in March 2021 compared to March 2019. Most of the recovery has been taking place in the service sector, with the exception of hospitality. Employment in manufacturing in contrast has barely recovered. At the same time manufacturing firms have recorded record level imports in the second half of 2020 and the first quarter of 2021. Further analysis is required to explore whether these trends reflect a substitution of inputs away from domestic supply chains towards international markets.
Firm-to-firm trade responded to the initial shock at the extensive margin - the number of firm-to-firm relationships with active trade dropped by 20% relative to 2019 in April and May 2020. During the same period, the average trade volume of firm-to-firm trade in active relationships was largely unaffected. Initially the number of newly formed relationships declined rapidly at the onset of the pandemic, but it recovered swiftly in line with domestic sales and purchases. Since the start of 2021 the number of new relationships declined once again - an indication that the impact of the pandemic far from over.
[3] For a summary of key policy responses see, for example: https://www.imf.org/en/Topics/imf-and-covid19/Policy-Responses-to-COVID-19#%23K
[4] Graphs available on request.
This note is based on research conducted as a part of PEDL ERG 7873, and follows previously published analysis of the short-term impact of Covid-19 on employment in formal firms in Kenya.