Estimates based on very credible post-COVID survey data from Bangladesh illustrate the sobering scale of the need. Using a nearly representative sample of urban and rural poor during the second week of April 2020, Rahman et al. (2020) find income losses of around 75% in urban slums and 67% in rural Bangladesh. Based on these data, the researchers estimate that roughly half the Bangladeshi population will be needing support of around $0.70 per day to maintain nutritional health. A universal basic income pilot in Kenya fixes the transfer rate at $0.75 per adult per day. These amounts imply expenditures of roughly $1.3 billion per month in Bangladesh.
Scaling these estimates up to the low-income and lower-middle-income countries in South Asia (SA) and sub-Saharan Africa (SSA), the need is $1.1 billion per day, around $0.5 billion of which is for India - levels that will represent half or more of the tax collection in most lower-income countries. Gentilini et al. (2020) report that, as of late May 2020, social assistance cash transfer programmes are operating in 124 countries, with an impressive total of $0.5 trillion committed globally. However, while the per capita commitment is $99 in high-income countries, it is $1 in low-income countries - an order of magnitude smaller than the Bangladesh data indicate would be required during each month of the crisis.
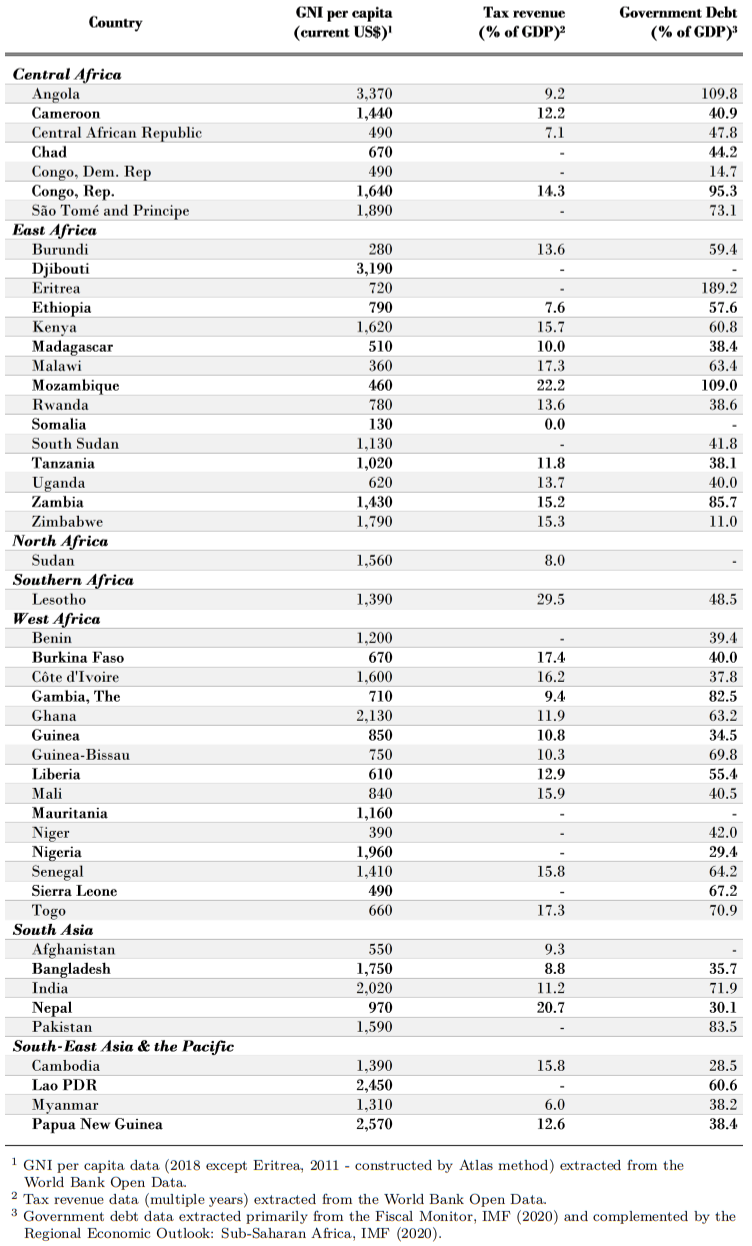
The lack of commitment to cash transfer programmes in lower-income countries is not surprising when we consider the resources available in those countries. Bangladesh collected taxes equivalent to 8.8% of GDP in 2018 (World Bank data), implying that the required transfer alone would account for over half of government tax collections. Table 1 shows tax revenue data for lower-income countries in SSA and SA. Population-weighted, the lower-income countries in these regions collect 11% of GDP in taxes on average, and tax collections are lower than 10% of GDP in many of them. This compares with 30% or more in higher-income countries. These data ignore the fact that tax collection itself is falling dramatically.[1] Although external debt levels vary from quite low (e.g. 14% of GDP in the DRC and 29% in Nigeria) to quite substantial (e.g. 86% of GDP in Zambia and 109% in Mozambique). However, aside from funding from the IMF and World Bank, most of the lower-income countries have little access to international financial markets, even in this period of excess savings.
Table 1. GNI/capita, tax revenue and government debt for select low- and lower-middle-income countries
[1] The Daily Star (22 May 2020) reports that tax collection fell by 57% in April 2020.